FOREX Gold Trading Strategies
XAU/USD Basics
XAU is a globally-recognized symbol that denotes 1 troy ounce of gold under the ISO 4127 currency standard. The FOREX market sees gold as just another type of currency. The price of the XAU/USD pair tells us how many US dollars are required to buy an ounce of gold.
Traders and investors have for long looked at the yellow metal as a hedge owing to its tendency to move inversely with certain currency pairs like the USD/JPY, USC/CHF, GBP/SEK, etc. Gold is popularly referred to as a “safe haven” because its value often increases when markets are in a risk-off mode and volatility starts to take over. This is why FOREX traders often diversify their portfolios through gold derivatives.
But, before dipping your toe in the pair and adding it to your portfolio, it is prudent to have a good understanding of the factors that drive the price of the XAU/USD pair so you can set up your strategies accordingly. Let’s get down to business and look at some strategies for trading XAU/USD.
FOREX Gold Trading Strategies
XAU/USD scalping strategy
The scalping strategy is inspired by arbitrage trading, where traders attempt to profit from a financial asset’s fluctuating price. Scalping is an ultra-short-term strategy that involves buying and selling a currency pair (XAU/USD in our case) within a few seconds or minutes.
Currency fluctuations are measured in terms of a pip (percentage in point), which is also a unit used by traders for measuring their profits or losses. For currency pairs quoted to 4 decimal places (unlike JPY pairs), a change of 1 pip means a change of 0.0001 in the quoted price.
FOREX scalpers hope to scalp anywhere between 5 to 10 pips per trade, consequently earning a healthy profit before the trading session ends by repeating the process.
Although FOREX scalping strategies are mostly plain-vanilla strategies, they usually involve leveraged trading.
What is leveraged trading in FOREX?
Leverage here means what it always has – borrowing. Unless you have massive amounts of capital or all you're after is some beer money, you’ll need to borrow money to earn a good profit trading FOREX. You can borrow this capital from your broker and gain more exposure to the market.
It is important to understand that leveraged trading brings the potential to deliver magnified profits and losses.
Scalpers rely on several technical indicators to place their trades. Some like to use the Relative Strength Index (RSI), while some choose to gauge their trades with forex trading signals. The bottom line here, though, is that you want to take advantage of small fluctuations in the price. The ticker ticks away at a dizzying pace so the speed is key when you are scalping.
Technical Analysis
If you are a technical analyst or a believer of the technical trading philosophy, you probably have heard of symmetrical triangles and pennants. it’s a chart pattern that shows we’re in a consolidation phase, suggesting that the price could potentially breakout.
Here are the 6 indicators that you could look for:
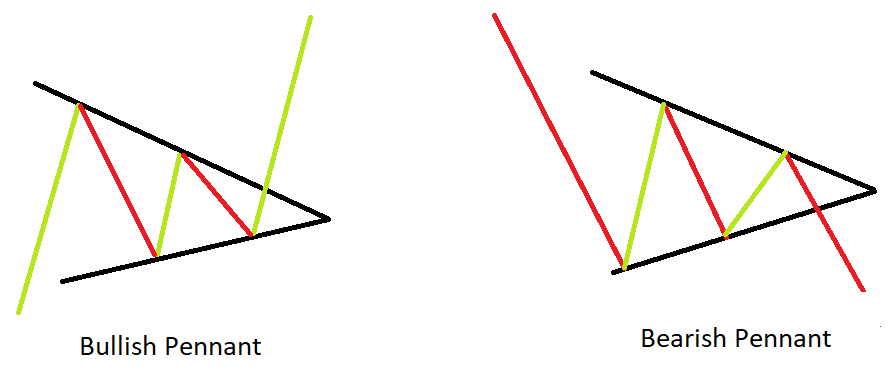
Bullish and Bearish pennants
Both these pennants have a “continuation” tendency, which means they will leave the compression phase in the same direction they had when they entered it.
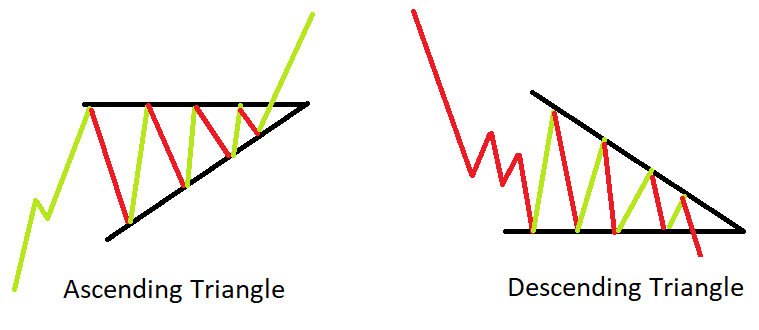
Ascending and Descending Triangles
These are compressions as well, and very similar to the pennants – but with 1 differentiating factor. The difference here is that they are up against horizontal lines formed by the support and resistance levels, so they could either leave the compression phase in the same, or opposite direction.
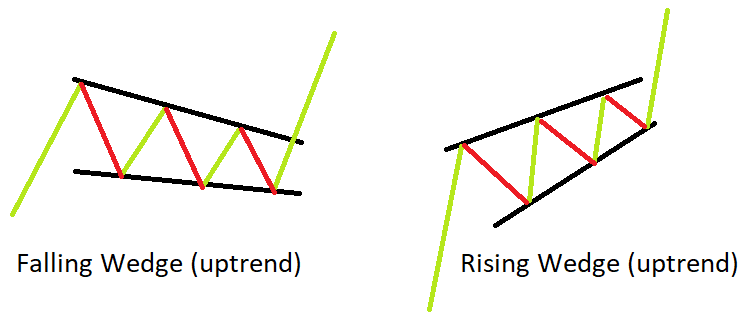
Rising and Falling Wedges
Imagine a long trend that takes a pause somewhere in between to enter a compression phase. These pauses are what form a rising or falling wedge. After the compression phase, the long-trend is likely to continue.
You will see the compression on the chart, much like a spring trying to compress the prices from both ends. Ultimately, one group (buyers vs. the sellers) will win and the price will break out. However, the direction of the breakout depends on a range of other factors.
To make the most of symmetrical triangle patterns and pennants, use them alongside other indicators like forex trading signals. If you have more indicators confirming what the symmetrical triangle pattern suggests, you’ll be less likely to eat a loss on your position.
Demand For Gold
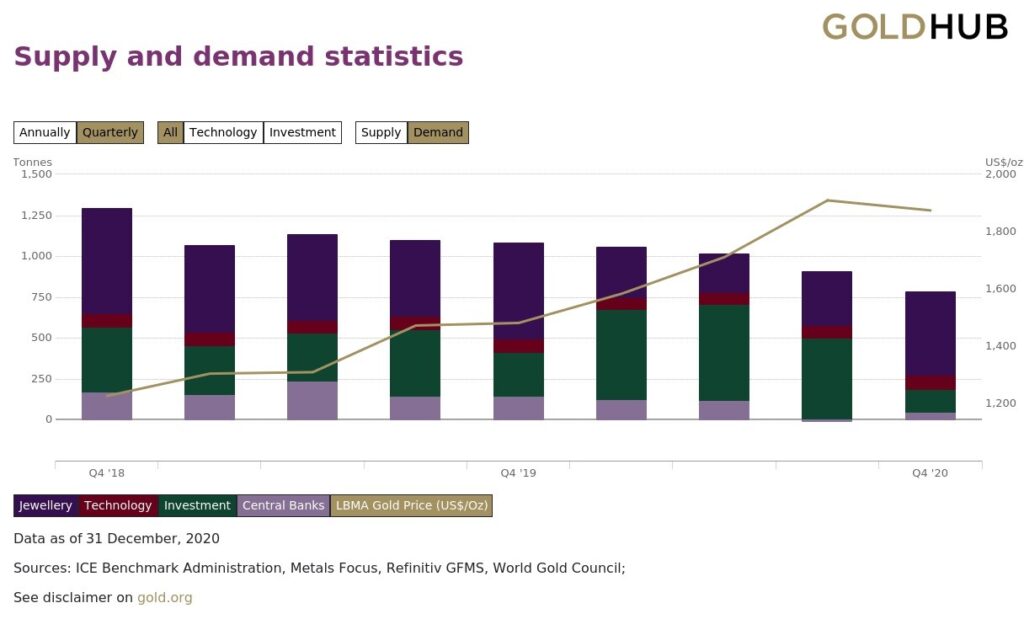
Let’s quickly revisit your high-school economics class. Do you remember drawing a demand and supply curve, where their intersection denoted the equilibrium price? That applies to gold prices, too. Gold has positive price elasticity, as pointed out by Erb and Harvey in their paper, The Golden Dilemma. To give this a more visual spin for ease of understanding, here’s a chart on gold demand and its price over the last 2 years:
Gold’s global supply remains constant in the short-term. Therefore, when there is a spike in demand, the price goes up. Demand could manifest in several forms. For example, certain industries could start demanding large quantities of gold for their on-going consumer projects.
But naturally, in addition to the industrial demand, you must also consider the metal’s consumer demand. Look at India’s and China’s gold demand, where gold is a very popular investment asset for cultural reasons.
If more and more gold is being mined every day, though, should the prices not fall given the constantly increasing supply? Well, not quite.
There is a good share of buyers and investors who simply do not trade gold. Since the buyers and investors (especially the ones in India and China) do not sell their gold for decades, it sits in their lockers – out of the market’s reach. So, the price is ultimately at the mercy of the new supply coming out of the mines and demand from industry and consumers.
Consumer demand is also influenced by seasonality. For example, it is an age-old tradition to buy gold during the Diwali season in India.
When you are drawing up your XAU/USD strategy, be sure to look around and see what the demand trends across the globe are suggesting.
Interest Rates And Inflation
Gold is strongly and inversely correlated with real interest rates. When the real interest rate rises, gold prices take a hit, and vice versa. The real interest rate is equal to the country’s nominal interest rate (set by the Central Bank) reduced by the rate of inflation in the country. Note that gold has no significant correlation with the Fed funds rate or nominal yields.
Intuitively enough, gold shares a positively correlated relationship with inflation. Simply put, inflation is a price increase, generally measured using a price index, for a specific basket of goods. Inflation effectively reduces your purchasing power. For example, if $10 buys you 5 apples this year, it may only buy you 4 the next year (or more than 5 if your country experiences deflation).
However, empirical data suggests that only a sharp rise in inflation will have a significant effect on the gold’s price. For example, the US witnessed high inflation in the latter part of the 70s and early 80s. During these years, the gold price shot up. However, there was also a short-lived inflationary period in the late 80s, during which the gold prices declined.
In conclusion, the price of gold has historically risen during periods of severe inflation. However, a short episode of mild inflation may not cause the price of gold to rise significantly. Nevertheless, it does make sense to be bullish on gold during a period of rising inflation, and bearish during a period of declining inflation.
Gold Buying by Central Bank
We discussed earlier how gold works as a hedge for times when volatility grips markets and economies. To counter such adverse fluctuations, central banks often buy gold and hedge themselves against the volatility-led risks. But this is not the only reason why central banks go on a gold buying spree. There are 3 primary reasons why central banks buy large amounts of gold:
A safe haven and a hedge against USD and other fiat currencies
The most striking feature of gold is its ability to sustain purchasing power, even when markets are panicking. It is a safe haven that preserves value and even generates profits during times of volatility and uncertainty. When the central bank believes the USD (or certain other currencies) is going to weaken, they hedge their currency risk by gaining exposure to the XAU/USD.
Negate the effects of inflation
While many tend to see inflation as an unfavorable scenario, that's not entirely true. Some degree of inflation is healthy. Too much inflation or deflation, though, are very real problems.
So, central banks buy gold to protect the country’s economy from being dramatically impacted by inflation. When you see the value of gold rise, know that this is suggestive of currencies being devalued.
Promote stability and foster growth
It is the central bank’s job to protect the economy against instability induced by a consistently devaluing currency. During such times, central banks use gold to control the magnitude and pace of the market’s growth.
In particular, emerging economies are more prone to free-market excesses. This is why countries like India and China use gold to counterbalance the risk.
You, as a FOREX trader, must read the central bank’s behavior. When the central bank starts to buy a sizeable amount of gold, you know that they expect volatility in the value of some major currencies. This is your cue to move your investments and park them somewhere less volatile, or hedge your risk. Obviously, one way to hedge is by opening a position in the XAU/USD.
If you act quickly, you may also benefit from a short-term capital gain as the central bank’s buying is likely to push up the price of gold.
Geopolitical Events
Political uncertainties are a very real threat to your liquid assets in the present times. To protect your wealth or profit from a trade following a significant geopolitical event, gold is a perfect asset. But, decoding the effects of geopolitical events on gold prices can sometimes be tricky.
Gauging geopolitical effects on the spot prices is a skill that traders will develop over time. Most fear-mongering news stories end up having little impact on prices in the medium to longer term. So, you must be able to develop the farsightedness to see if any emerging geopolitical tension will manifest into something more disruptive.
Generally, the worst-case scenario here is a war. Wars come with extreme ramifications for the economy. They bring unfathomable expenses and deplete the country’s financial as well as labor resources. However, a more moderate, and a much more likely manifestation of geopolitical unrest are sanctions.
With sanctions, you will want to analyze the countries involved and estimate the degree to which it will affect the spot prices of your investments. For example, North Korea has been facing sanctions for over a decade now but has had little to no impact on spot prices of the XAU/USD or other currencies. That is because North Korea is a very small economy with few goods to export.
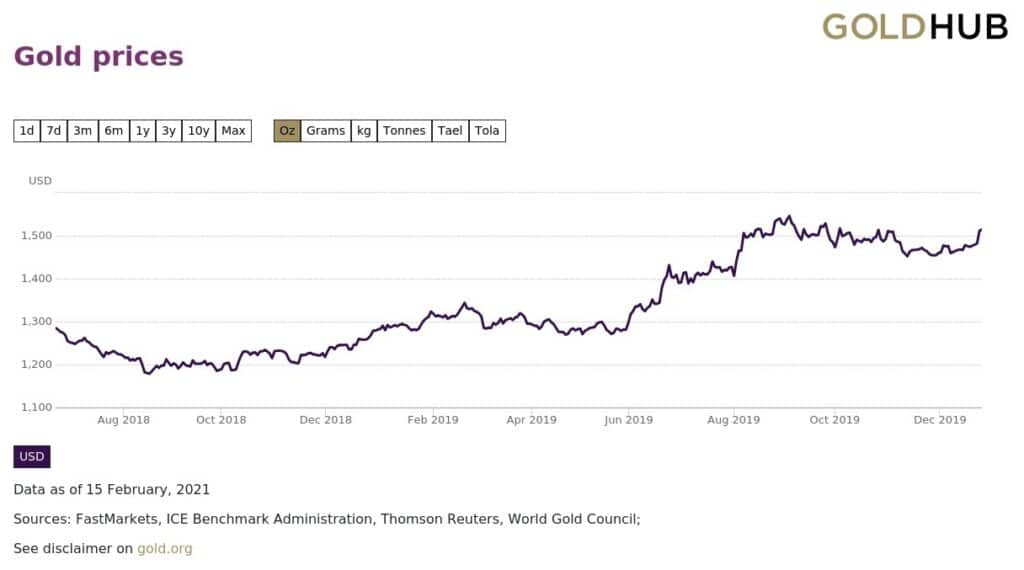
On the other hand, the trade war between the US and China induced a sharp rise in the XAU/USD. Simply owing to the economic prowess of the countries involved. Here is how the trade war impacted the gold price between July 2018 and December 2019:
As you map out your XAU/USD trading strategy, look at the current geopolitical landscape and see in which direction the pair is likely going to trend.
Final Thoughts
While you will need a slightly different approach for the XAU/USD, a lot of the factors that need to be evaluated while trading any regular currency pair will still apply. You can use forex signals to help guide your trades.
As a FOREX trader, you could either use XAU/USD to hedge your positions or build strategies to derive profit from trading. If you are a beginner, though, stick to using gold as a hedge for now and once you have some experience with the yellow metal, you can take a deeper dive.


